How to Measure the Partisanship of Every House Seat
December 8, 2023 · 11:30 AM EST
What are the most evenly-divided House districts in the country? It’s not as easy as just looking at the past presidential results, considering down ballot races can have their own unique circumstances. That’s why Inside Elections created a metric to measure partisanship in each district.
Inside Elections’ Baseline captures a congressional district’s political performance by combining all federal and state election results over the past four election cycles into a single score. This index aims to approximate what the “typical” Democrat or Republican might receive in any given district.
See Baseline for every state and district in the country in table form here, and in interactive map form here.
What makes Baseline different from some of the other metrics out there is its depth. Most references to competitiveness focus on the margin in the most recent congressional election or the most recent presidential result in the district. It’s also common for other major statewide results, such as Senate and governor, to be broken down by district, especially when those races are competitive.
But Baseline — by design — requires more. Along with the offices listed above, Baseline includes all statewide elections for executive and constitutional offices, from the common (lieutenant governor, attorney general, secretary of state, treasurer, auditor) to the obscure (including mine inspector in Arizona and railroad commissioner in Texas).
Unfortunately, most states don’t officially report the results of these races at this level. So in order to gather the necessary data for Baseline, we manually calculated the results of every federal and state election in every state between 2016 and 2022 by congressional district — over 750 races in total, or approximately 7,950 results when broken down across all 435 seats. By including these extra elections, Baseline seeks to cancel out individual candidate traits and race or cycle anomalies: its benchmarks for a “typical” Democrat or Republican are based on an average of practically all previous performances from each party in that district.
You can read in detail how we crunched all the numbers here.
Looking at the current House map, including the redrawn lines in Alabama and North Carolina, the typical Democrat has an advantage in 220 districts according to Baseline, while the typical Republican has an advantage in 215 districts.
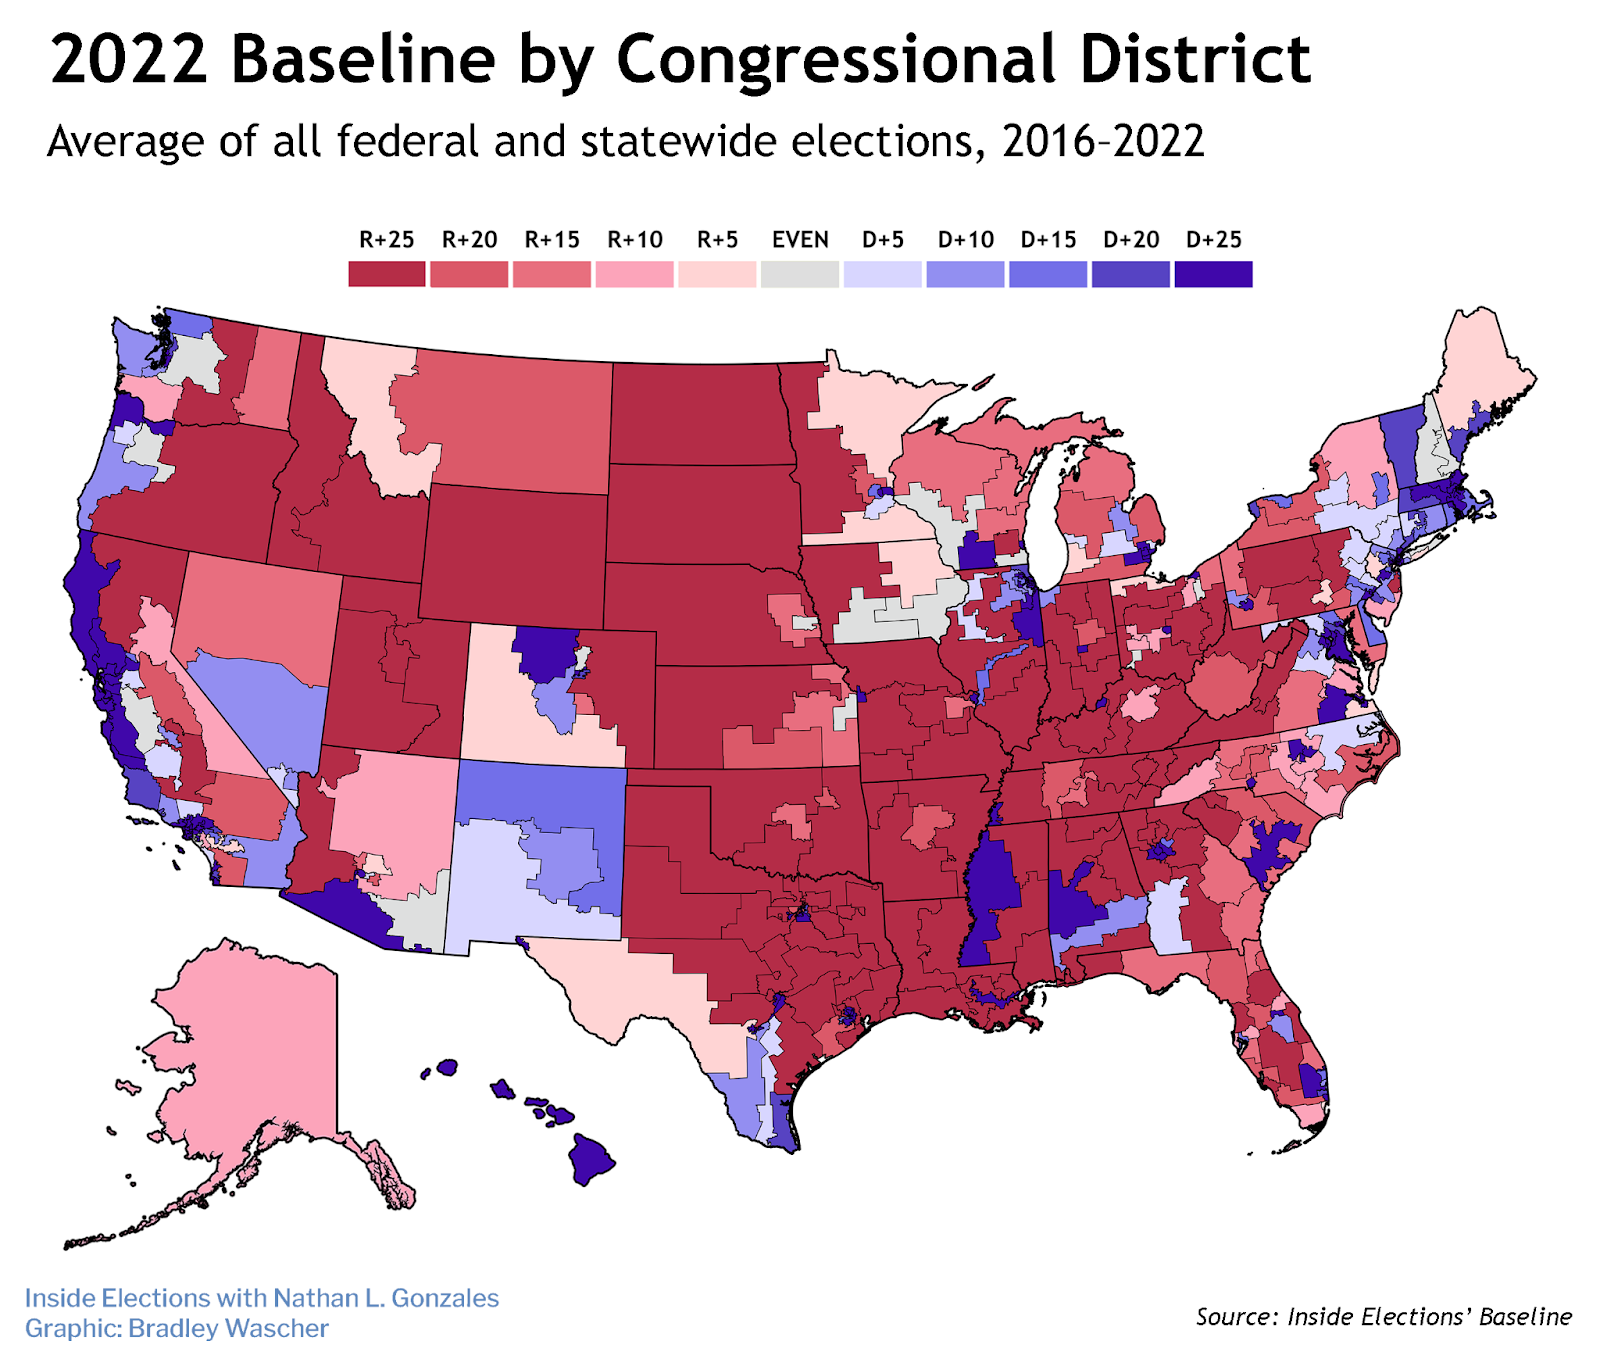
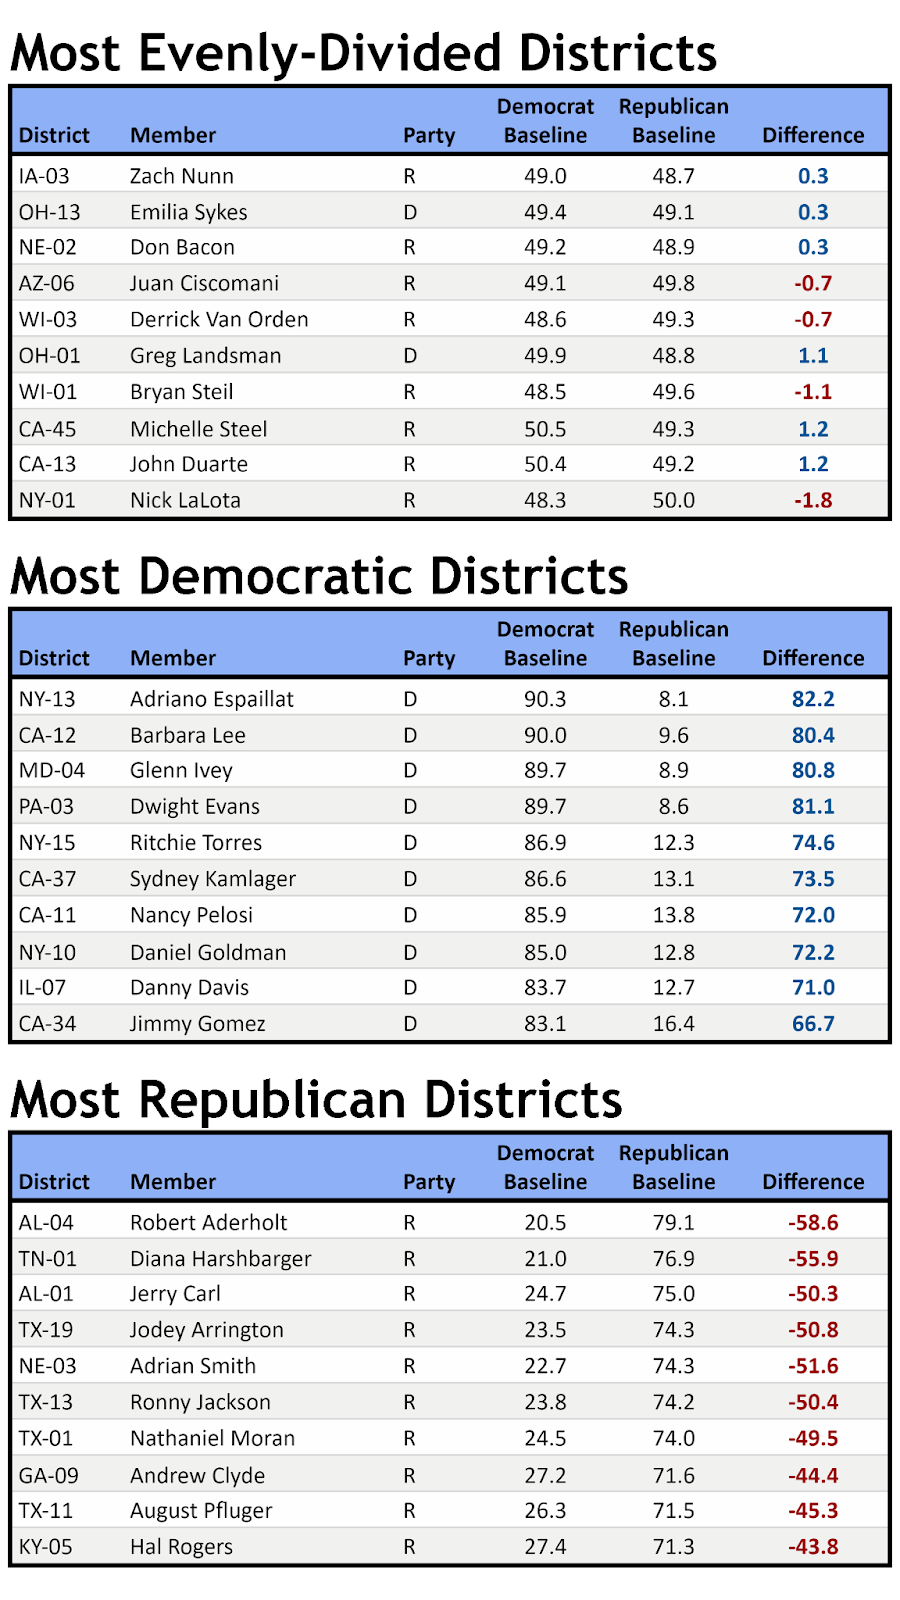
The most evenly-divided district is Iowa’s 3rd, represented by GOP Rep. Zach Nunn. There, the typical Democrat’s expected edge is less than one-third of a point: 49 percent Democratic vs. 48.7 percent Republican. Four other seats’ Baseline margins are within a point: Nebraska’s 2nd (D+0.3), Ohio’s 13th (D+0.3), Arizona’s 6th (R+0.7), and Wisconsin’s 3rd (R+0.7). That’s part of the reason why GOP Reps. Don Bacon, Juan Ciscomani and Derrick Van Orden, as well as Democratic Rep. Emilia Sykes, are on the list of competitive races.
Zooming out, 43 districts fall within a 5-point margin, with 25 of those slightly preferring Democrats. And 83 districts are within 10 points, 51 of which favor Democrats.
The most Republican-leaning district is Alabama’s 4th, represented by Rep. Robert Aderholt, where the typical Republican would expect to earn 79.1 percent against the typical Democrat’s 20.5 percent — a GOP advantage of nearly 60 points. The most Democratic-leaning district is New York’s 13th, represented by Rep. Adriano Espaillat, where the typical Democrat would earn 90.3 percent, 82.2 points ahead of their Republican counterpart.
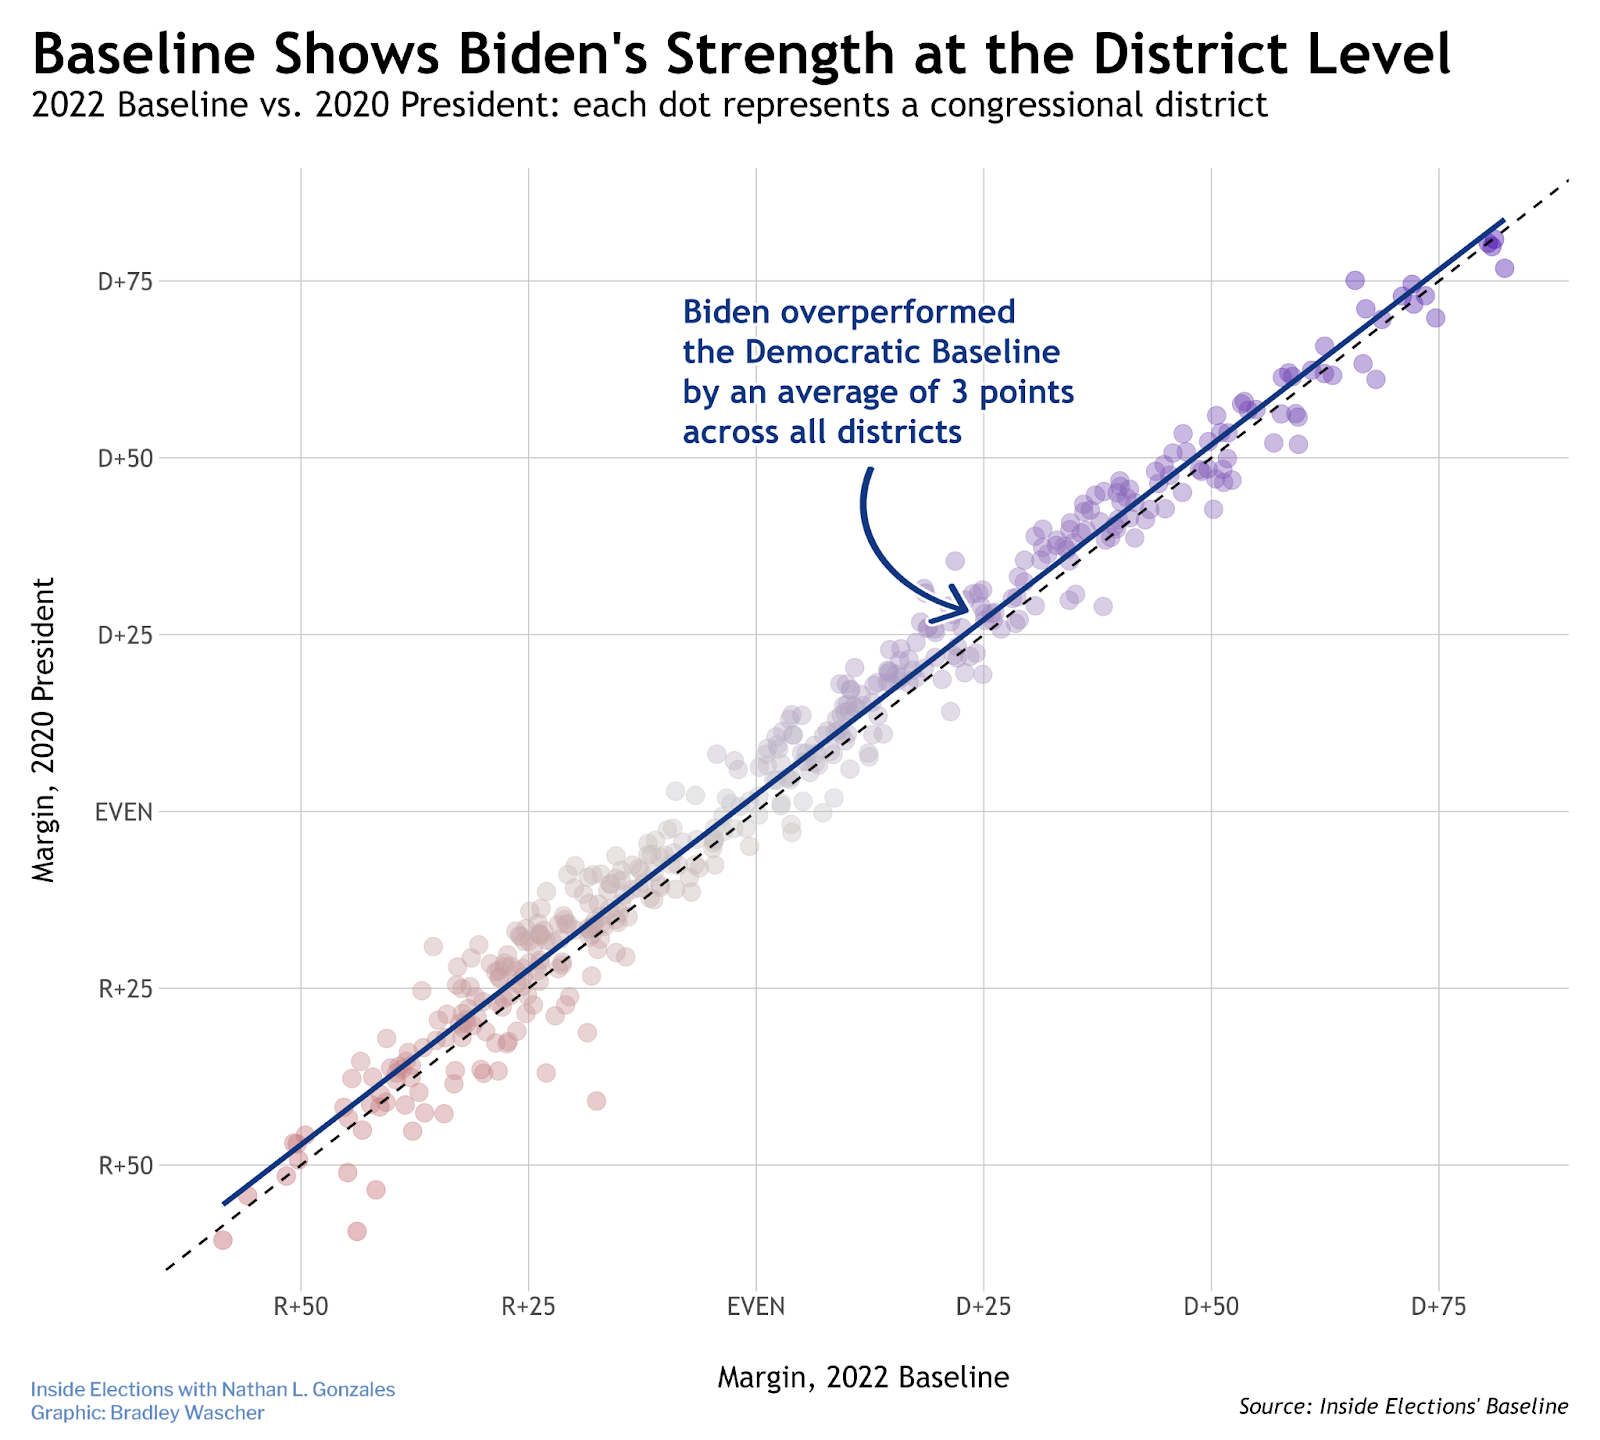
Unsurprisingly, Baseline averages don’t differ much from individual races: a district’s 2022 Baseline margin was 97 percent correlated with the results of the 2020 presidential election, and 95 percent correlated with the 2022 House race.
These comparisons show how Baseline can be used to estimate candidate quality. For example, Biden overperformed the Democratic Baseline by an average of nearly 3 points across all districts. While there are caveats to comparing our 2022 Baseline predictions to the actual 2020 results, this lines up with other indicators — at the state level, Biden outpaced the Democratic Baseline by an average of 1.2 points, and nationally, he won the popular vote by 4.5 points — highlighting his relative strength as a candidate on multiple electoral levels.
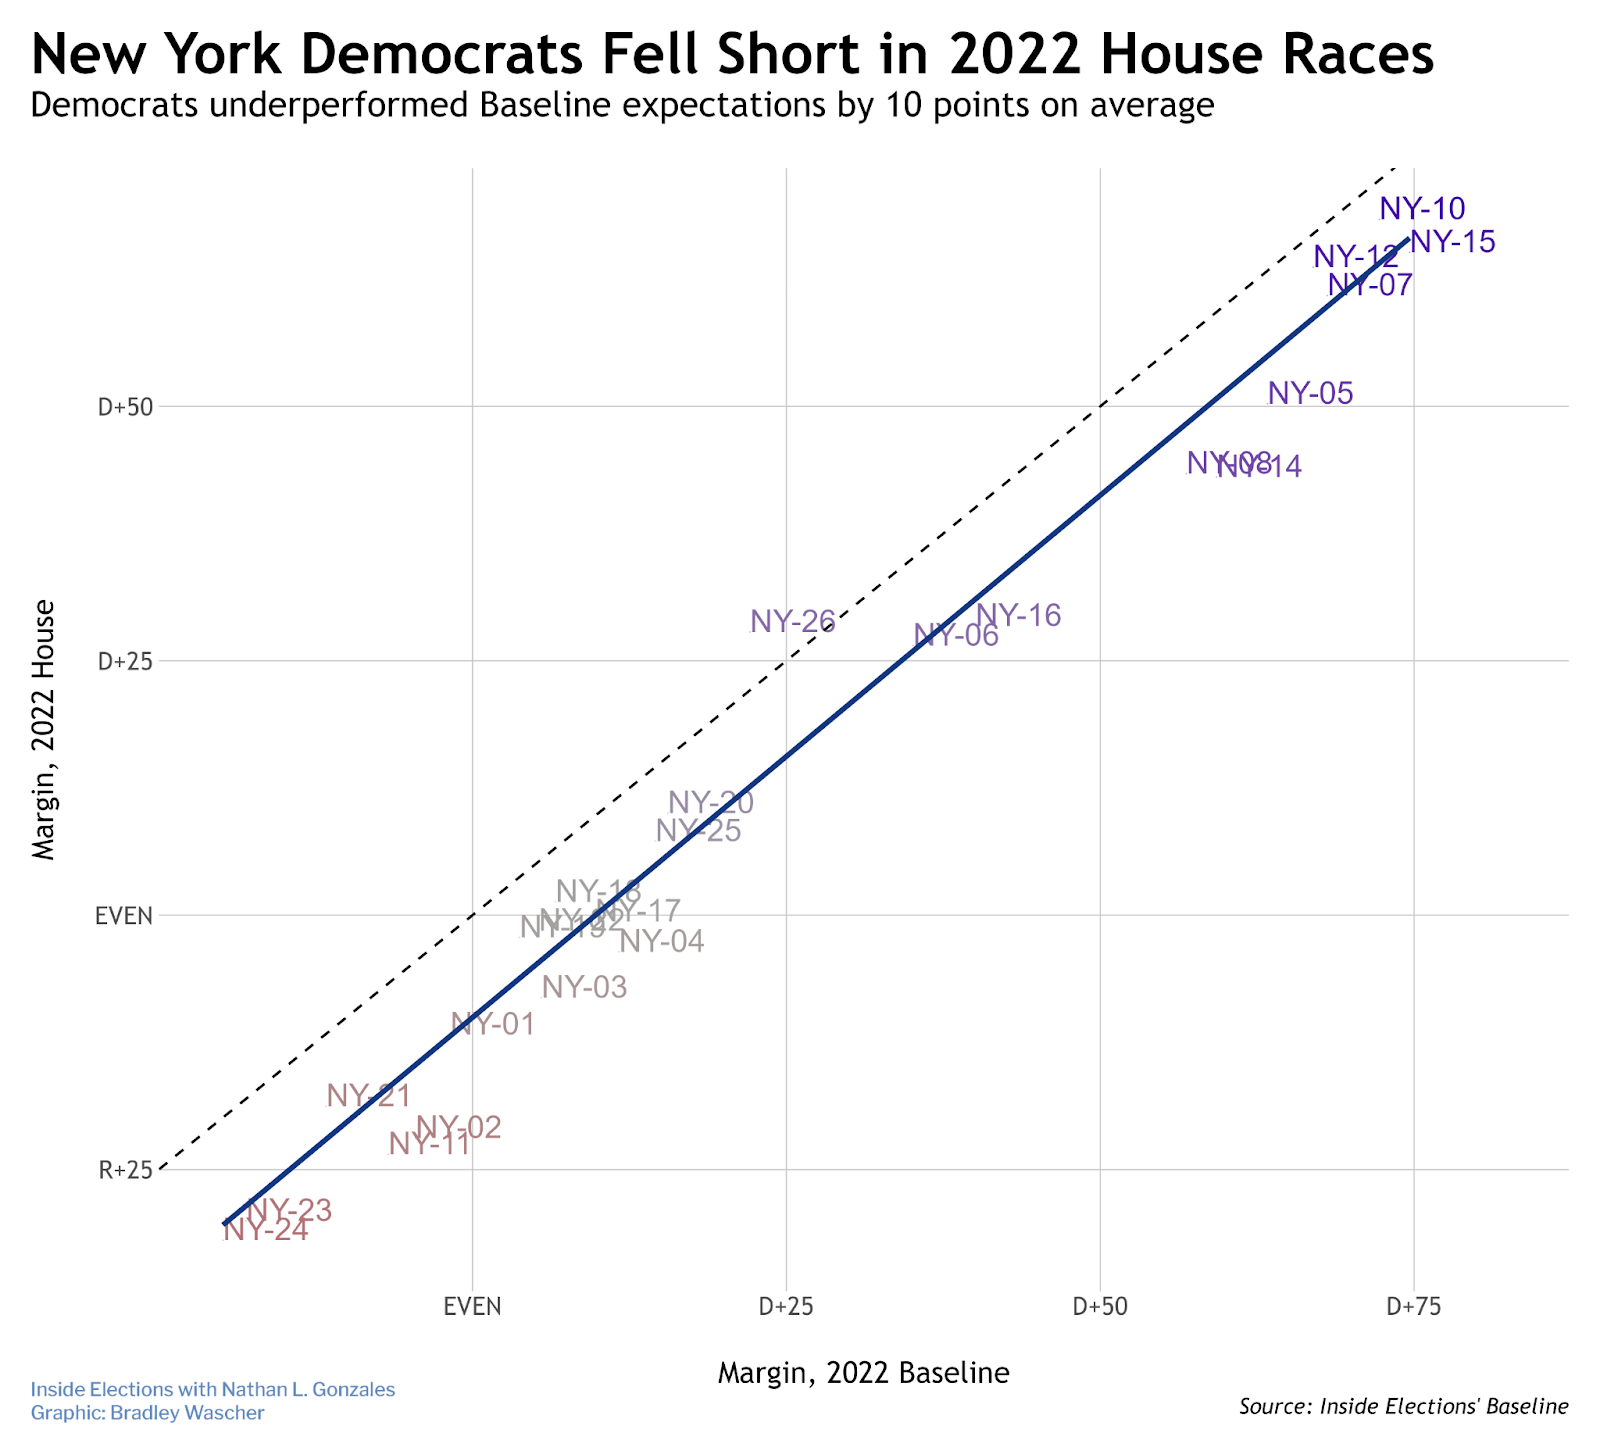
Baseline also adds context to 2022. Generally, our metric slightly overestimated House Democrats in moderately Democratic districts — dragged down by weak showings in otherwise friendly states. In California, although Republicans won five House seats that Biden had carried two years earlier, Baseline suggests Democrats managed to do just poorly enough overall to lose without totally tanking their margins. That’s in stark contrast to New York, where Republicans carried six Biden-won seats and the bottom really did fall out: Empire State Democrats underperformed Baseline expectations by 10 points on average.
Republicans, on the other hand, did not see the same attrition in GOP-favored districts. And while Democrats won the majority of House races nationwide within 5 points and 10 points, Republicans actually performed better relative to Baseline in these battlegrounds — all leading to a narrowly divided election with no definitive national narrative.
With Baseline in the books, it’s easier to quantify candidate strength. Identifying which candidates are “strong” and which ones are “weak” is another basic element of political analysis. We’ll unveil Vote Above Replacement (VAR) scores for the 2022 House candidates in an upcoming article.